
How to Create a Custom Report using Rocket Columns (Using Optimizely Data Platform)
Building custom reports in Optimizely’s CDP is quick and its capabilities are surprisingly powerful and easy to use!
In today’s example, I will create a report to show which of our forms are converting the best. One of the benefits of ODP is that it can ingest data from many systems and harmonize that data so I can see it all in one place.
Why would you want to do this? I want to do this because we want to drive more spending to the forms that are converting and we might want to experiment on the forms that are lacking.
To start, we are going to navigate to Company>Reports and then select the New Report button.
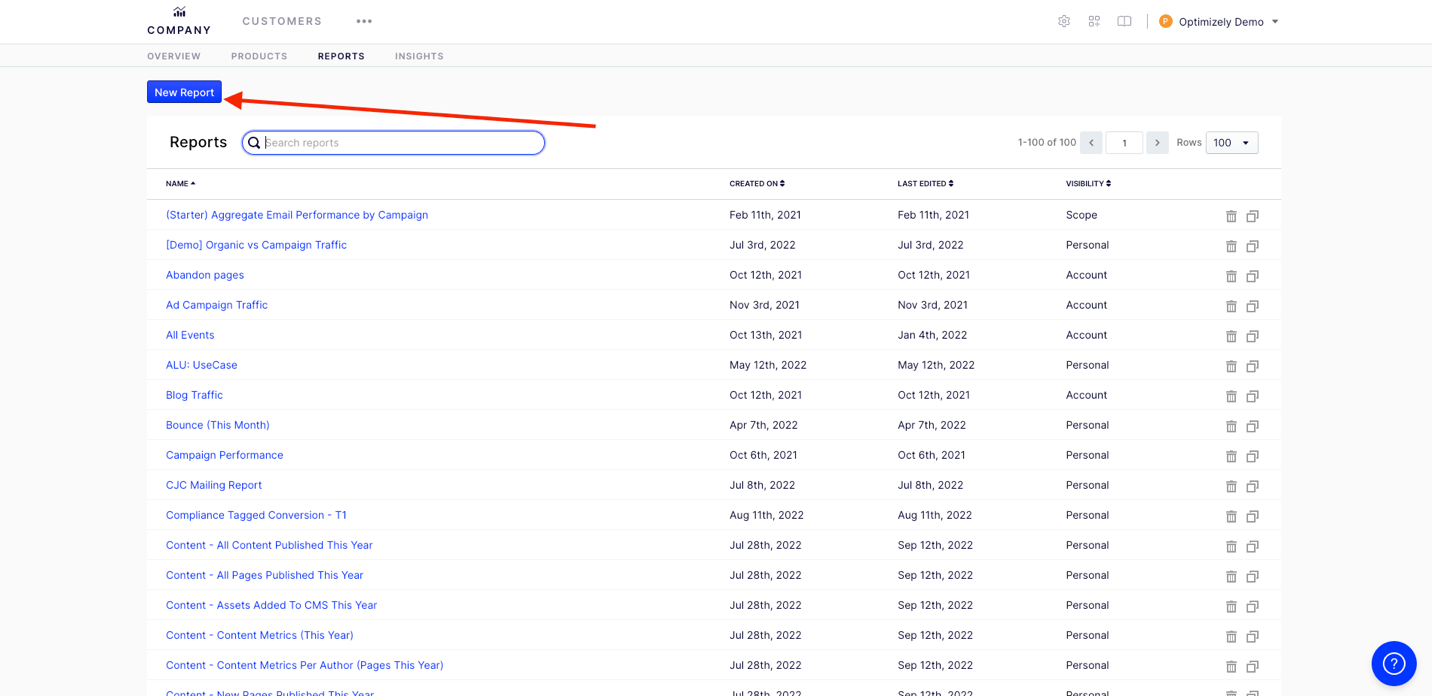
After I select a new report, I will have to set a few parameters to be able to visualize my report.
We need to set the
- Segment
- Date Range
- Filters
- Columns
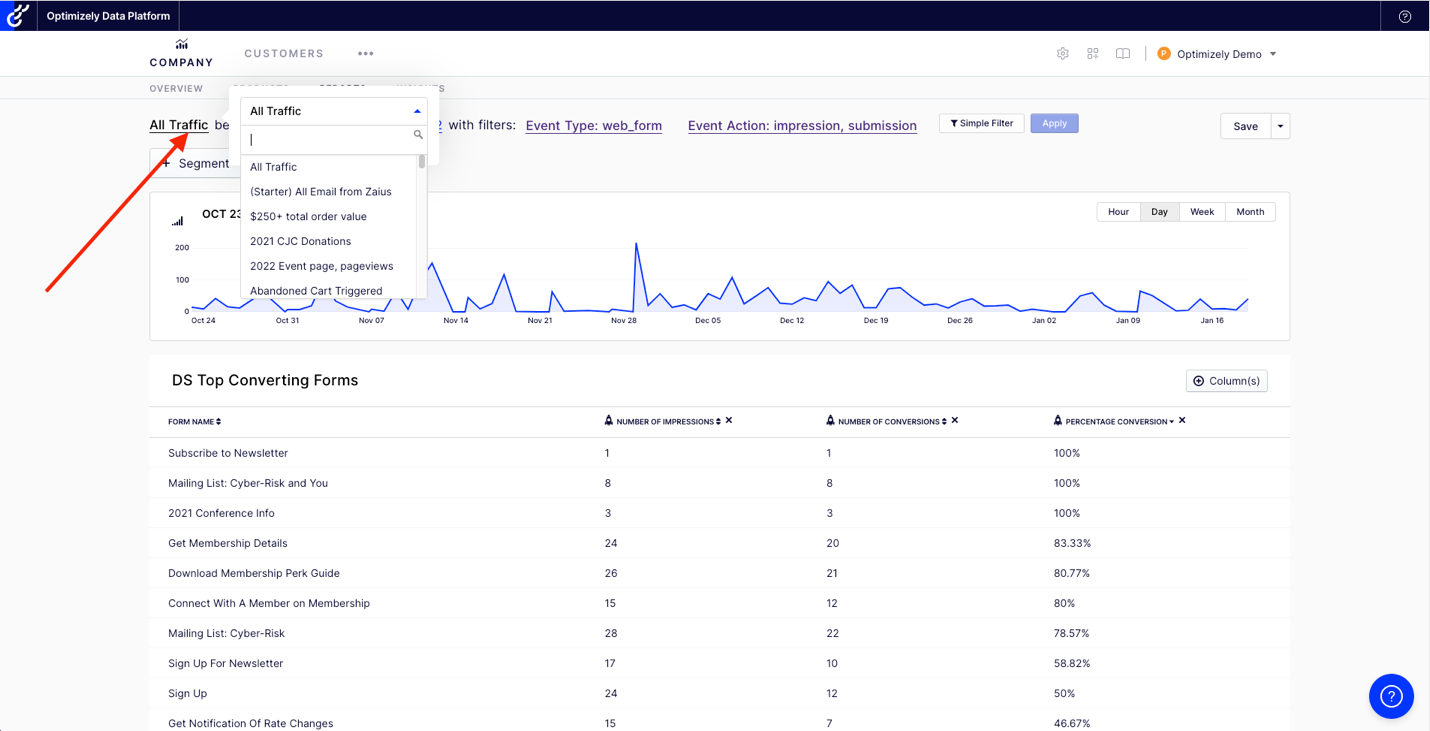
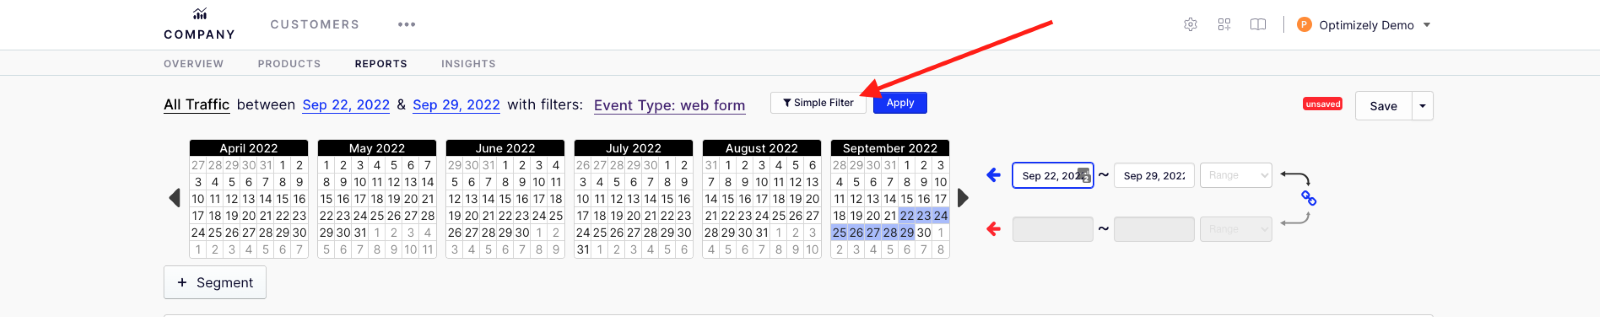
ODP allows you to filter your traffic into segments, but for this example, we are going to select All Traffic. For more information click How to create segments.
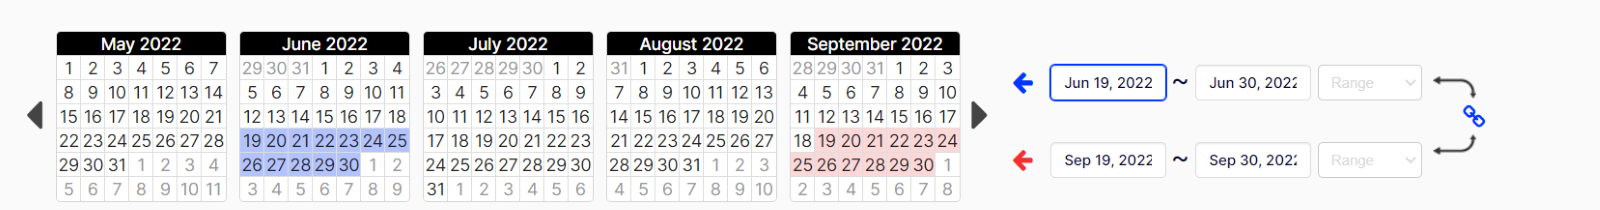
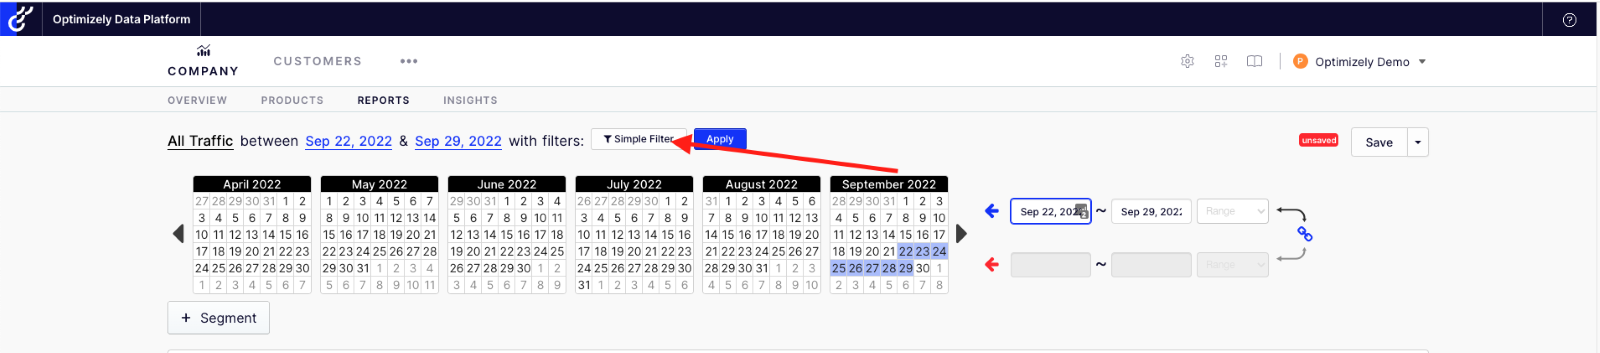
After selecting the segment of traffic you want to use, you will select the data range,
Now, we are going to select all the filters we want to use to drill down to the form events themselves to see events like impressions and submissions of those forms. Lastly, we want to calculate the conversation rate.
After you click, you will see a dropdown selector of all the Event types and actions as well as all the filters you have access too. We are going to select Event Type: Web Forms. Click here to find out how to create filters.
Once Selected, I am going to add two more filters for Event Action: One for impression and for submission of the forms so I can calculate the conversation rate, my filters will look like this.
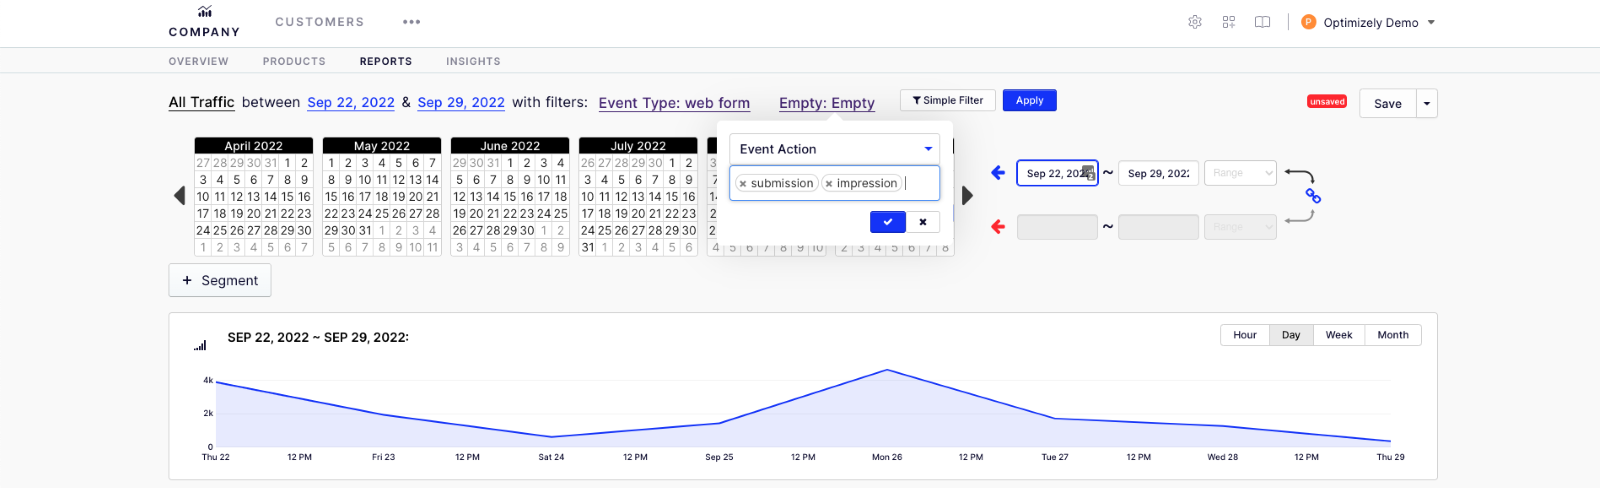
Now that I have selected all the attributes for my report, I can now apply and see the traffic that is associated with them.
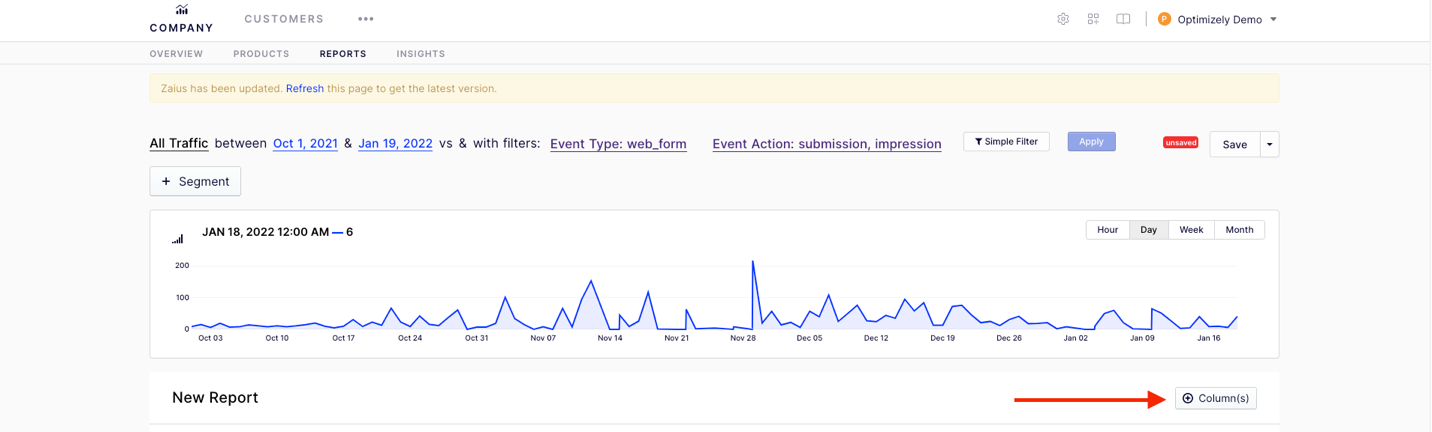
I can now set my columns so that I can list and total my data.
Adding Columns and Rocket Columns
To display the totals or formula or ratio for different events, you can use rocket columns. A rocket column allows you to craft a powerful expression sentence to further segment your results.
For this example, we are going to use the Events attribute to drill down to the form name. First Click + columns
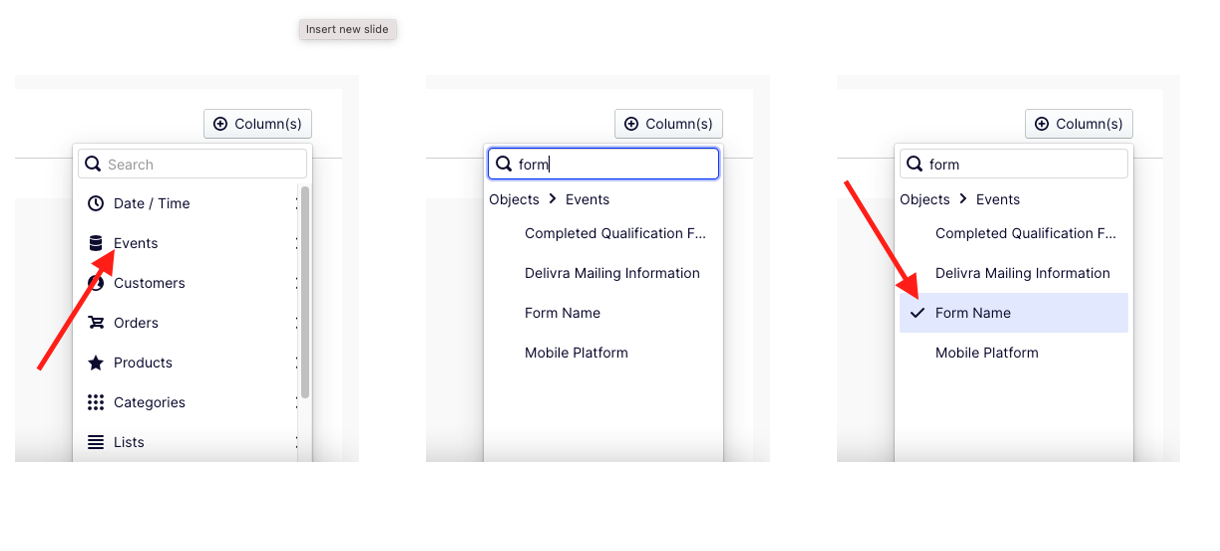
We will be present with all the different options we have for drilling down into a report.
For this example, report, we want to see the:
- Name of the Form
- How many impressions each form had
- How many submissions each form had
- Calculate the conversation rate for each.
We will first add the form name, so after clicking + Column(s) you select Events>search for form>select form Name.
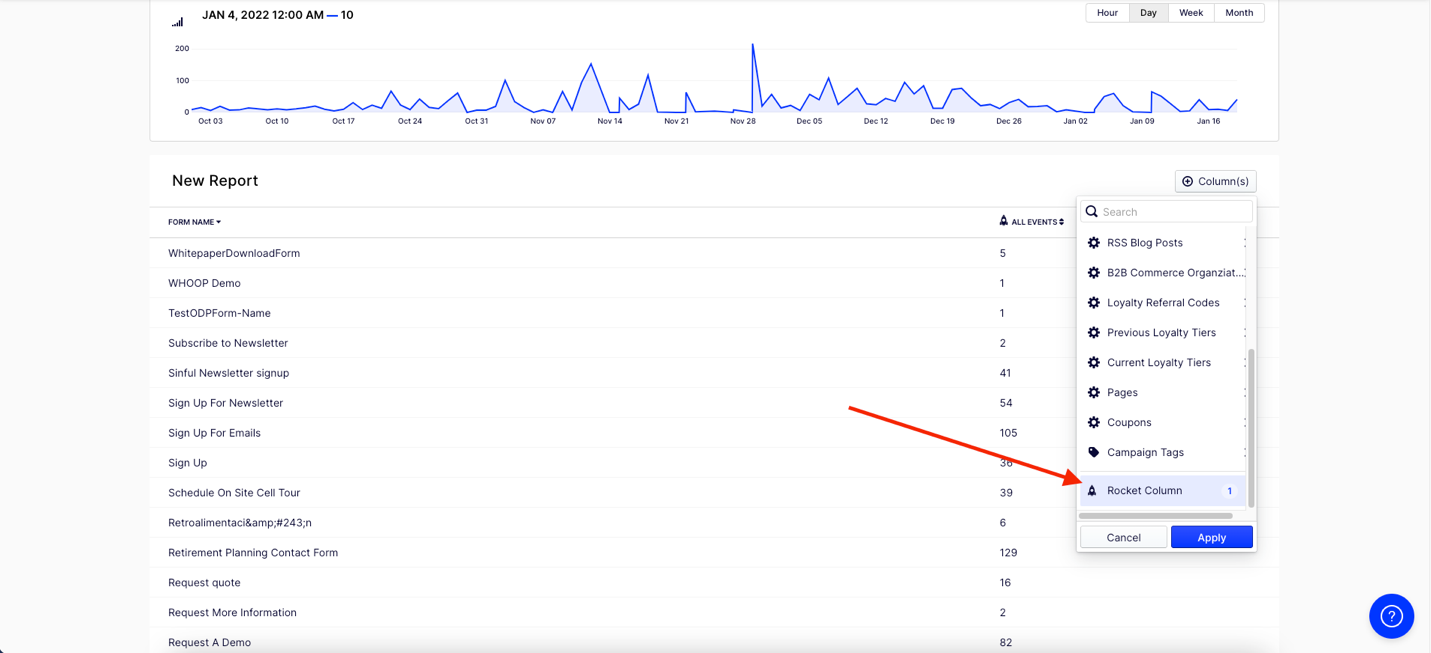
To complete our report, add Rocket columns, which you will find at the bottom of the list of attributes to filter from.
A rocket column allows you to craft a powerful expression sentence to further segment your results. The default column of events and data displays when another field is selected.
Once clicked you will be able to configure your columns to display the information the way you need to see it. We are going to hit the + Column 2 more times as we are going to configure 3 columns total.
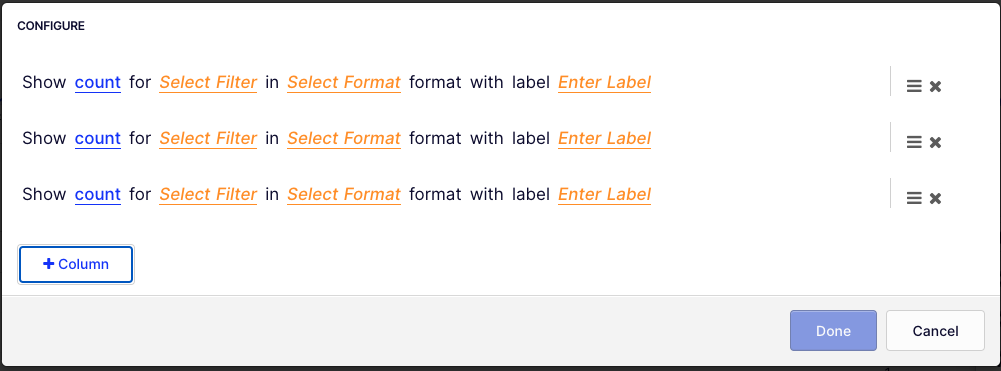
To configure the rocket columns, make the following edits. (Please note: Your filters will look different. Here is a blog that will help in creating filters. https://blog.danisaacs.net/optimizely-data-platform-odp-tracking-and-usage-examples/#usage-in-odp
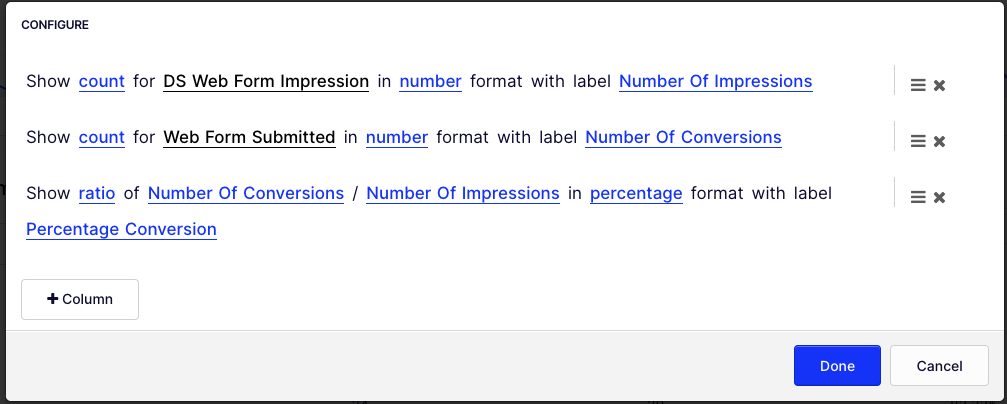
- Show Count for DS Web Form Impressions in number format with the label Number of Impressions.
- Show Count for Web Form Submitted in number format with the label Number of Conversions.
- Show ratio for Number of Conversions / Number of Impressions in percentage format with the label Page Conversion
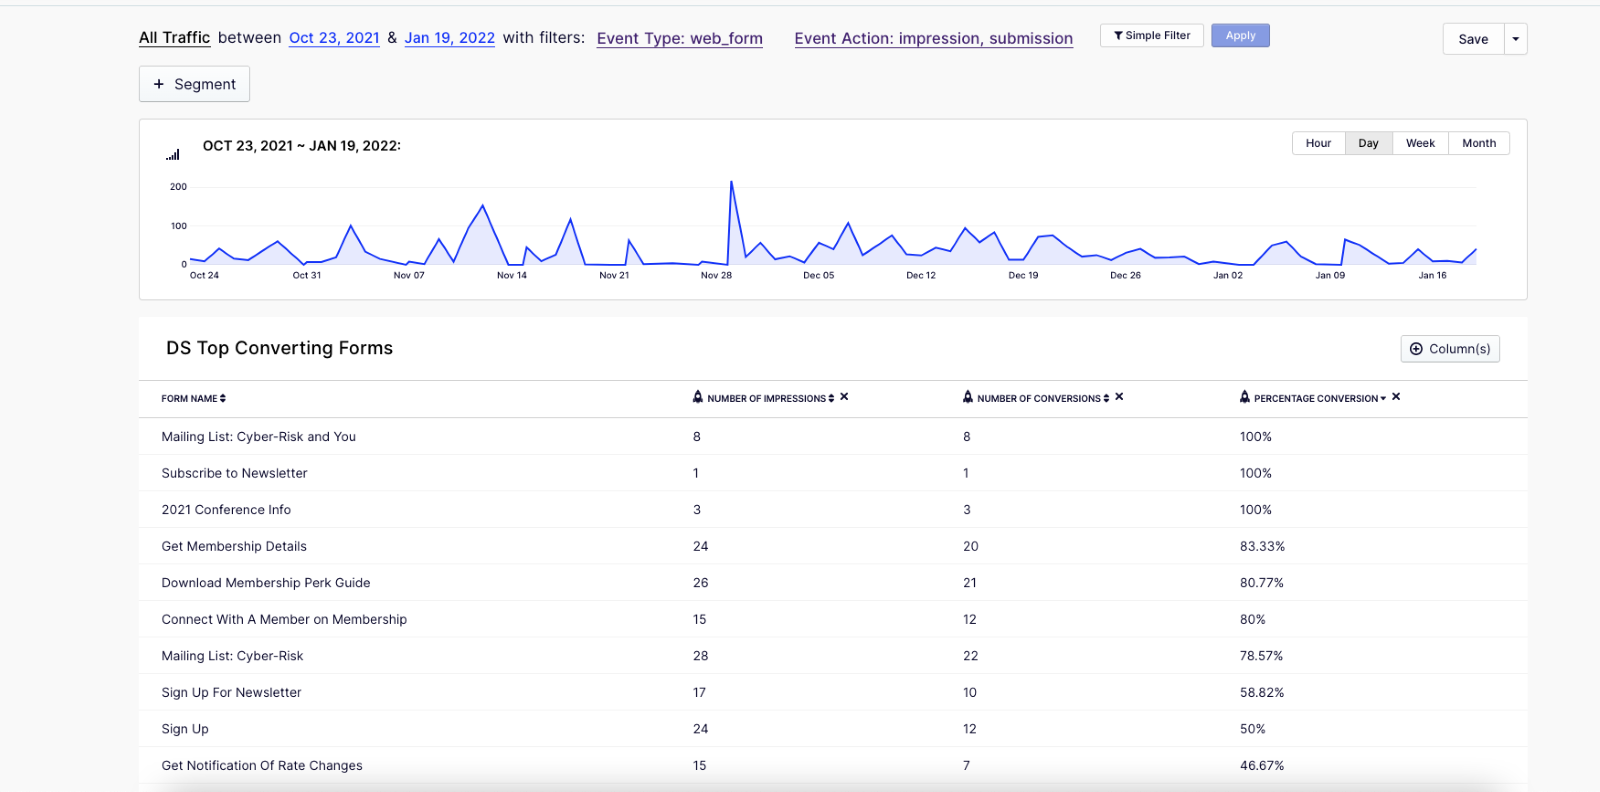
With those columns, all set, click done and your report is ready for consumption. You can clearly see which forms are converting and which of them I might need to optimize.
Lastly, I will close by suggesting that you optimize the forms, using our Optimizely Web Experimentation platform to quickly test and determine the higher-converting version of that form and related content.
Fan-tastic!