
How to Determine Which Test Metrics to Select
When preparing to build a test in Optimizely Web Experimentation, we often know what we want to change and where we want to change it. Even knowing who we want to target may come to mind rather easily. However, knowing exactly which metrics we want to be able to track and measure can oftentimes give us pause during the planning stage.
The Primary Metric
Think of your primary metric as the key piece of information that you need to determine whether or not your test will produce the desired effect of your hypothesis. This data point acts as your validation metric or “proof point” that will either prove or disprove your test hypothesis.
- Tip: Look at your test hypothesis for clues.
Ideally, your primary metric can be tracked on your Targeting Page to ensure that the success (or failure) of your test can be directly attributed to the results of this metric. In other words, the farther your primary metric is placed from the Targeting Page, the more other variables could influence user behavior before reaching the primary metric of your test.
If distance is created between the page where the user sees the change (Targeting Page) and where the user is expected to take action (primary metric), there exists the possibility that additional factors could influence the user’s behavior between these two points.
In other words, the user action that corresponds to your primary metric should exist on the page that you are testing to avoid being influenced by other outlying variables.
Let’s take for example, a test in which we change the Add to Cart (ATC) button text in the variant from “Buy Now” to “Get It Now” to see if this wording would entice more users to click onto this button. (After some research in semantics, we are interested to learn if “get” as a word that alludes to the speed of receiving the product would be more appealing to users than “buy” as a word more associated with the purchase of the product.)
Now, while we ultimately want users to complete their purchase journey, the main purpose of this A/B test is to see if more users will click onto the Add to Cart button on the variant versus the control. Therefore, our primary metric to track will be Add to Cart button clicks.
Notice how this primary metric also exists on the Targeting page where the user action (click on ATC button) takes place for direct attribution to test failure/success.
As you can see through this example, the primary metric for tests on an e-commerce website is not always a revenue metric. Even though revenue per visitor (RPV) may be a focus metric for an e-commerce website and supports business objectives, we cannot assume that this metric will always be the primary metric of tests performed on that website.
- Tip: Consider the desired result that the variant of this test is expected to produce in order to determine the primary metric for the test.
Secondary Metrics
Revenue, however, does remain an important metric to keep in mind, as the changes made in the variant may ultimately impact how much revenue is generated by this test. So, while not the primary metric for this test, revenue generated by this test will still be interesting to compare between the control and variant.
This is where secondary metrics, or metrics of next importance, come into play. For this particular e-commerce example, secondary metrics that would be relevant for this test might be revenue per visitor (RPV) and total revenue generated.
Additional metrics of consideration could include:
- Conversions
- Conversion Rate
- Average Order Value, or AOV
Notice how the above metrics also provide insight into the different stages of the customer purchase journey. Several actions are taken from the moment a user lands on your website to the point at which s/he makes a purchase. While this final destination, or conversion point, of the customer journey is worth our attention, so are the steps in-between.
Secondary metrics give us the opportunity to take a closer look at certain user actions and behaviors that take place along the customer journey, so that we can observe progress and drop-off, step-by-step.
Prioritizing Metrics
Within Optimizely Web Experimentation, metrics are ranked according to priority. At the top of the metrics list, the primary metric is ranked highest and will therefore be prioritized first. Each (secondary) metric added thereafter will then be ranked in subsequent priority. So, once you have established your primary metric in your list, consider how important each additional metric will be to your test and then add these secondary metrics in that order.
In Optimizely Web Experimentation, secondary metrics appear gray, in contrast to the primary metric that will be shown in blue. The prominence given to this “blue” metric can serve as a reminder to double-check your metrics setup and ensure that the most important metric for this test is placed at the top, as the primary metric
- Tip: Use the drag-and-drop functionality within the Metrics section to reposition your metrics if needed. Move the metrics around until you feel satisfied with the order of priority that you give to each. Notice how the metrics will automatically change color based on their placement. A metric placed at the top will automatically become blue and identified as your primary metric, while metrics placed further down the metric list will be gray.
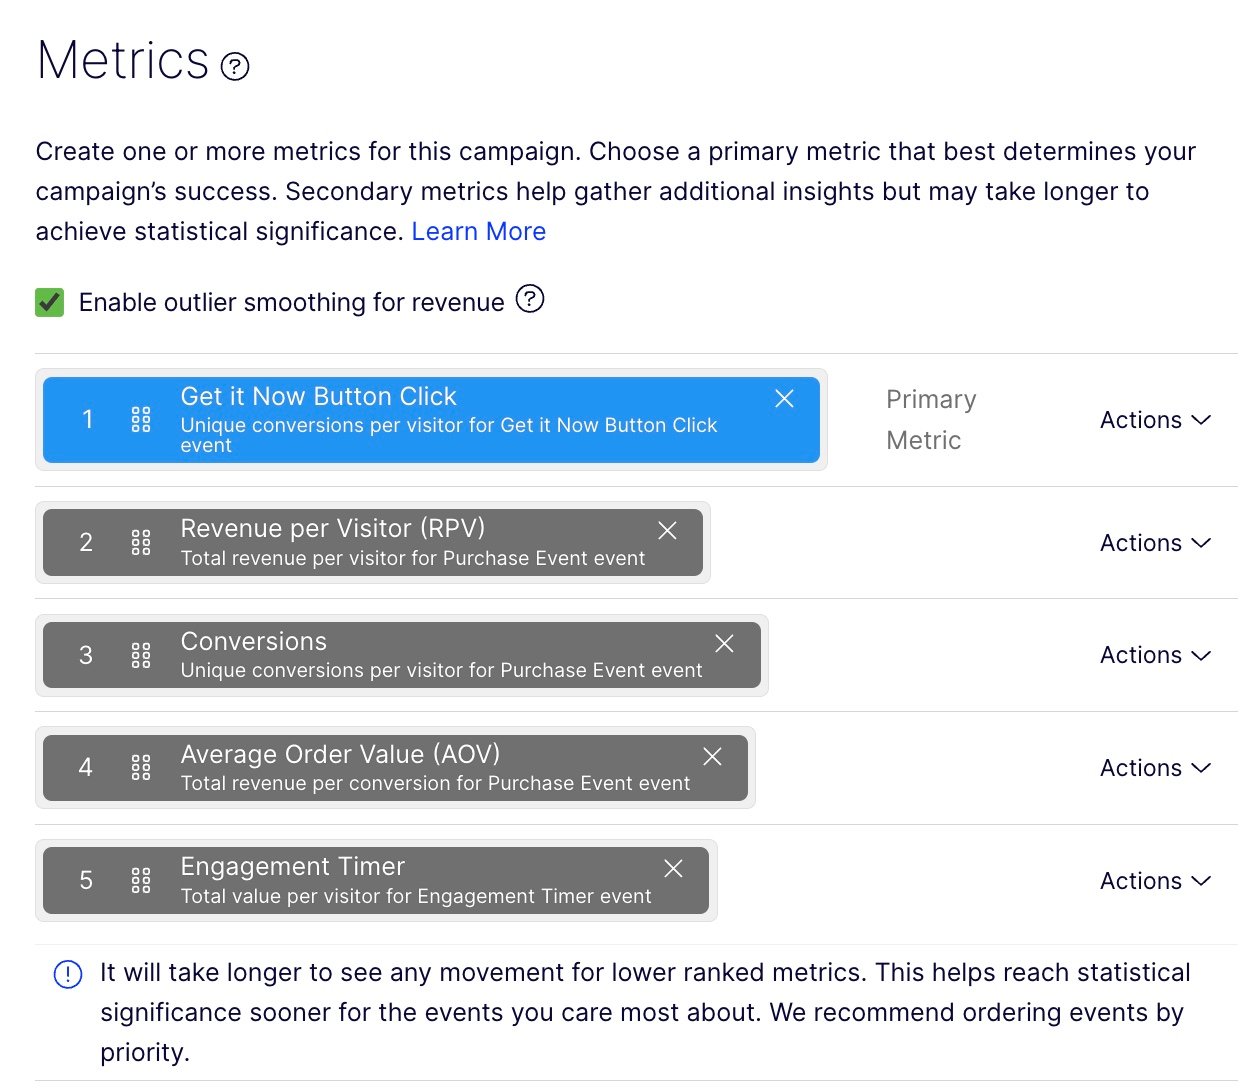
While you might be eager to add a plethora of metrics to your test to diversify your insights, more metrics does not necessarily equal better results. More metrics may impede the speed at which your highest ranked metrics can reach statistical significance, which would then require your test to run for a longer length of time.
When more than five metrics are added to a test in Optimizely Web Experimentation platform, you will notice a cautionary message appear. This message advises against selecting too many metrics for a single test. Therefore, as a general rule of thumb, try to stay within a range of one to four additional metrics in order to reach statistical significance for the metrics that matter the most for your test.
Monitoring Metrics
Monitoring metrics can also lend insight into other effects that may have resulted due to differences between the control and the variant(s). While the variant is created with the purpose and intention to produce a specific change from the original (or control) version of the target page, this change between versions may impact other factors within the user experience.
Some common monitoring metrics include bounce rate, exit rate, average engagement time, and scroll tracking percentages that let you see if the changes in the variant increased or decreased content consumption on the Targeted Page. These metrics can even be paired alongside other clickstream analytics and/or heatmapping tools for deeper insights into user behavior and engagement caused by the variant.
Together, with the primary and secondary metrics, monitoring metrics can help to provide you with a holistic view of the impact that your test had on the overall user experience.
Edit, Review, and Finalize Your Metrics
With so many metrics at your fingertips, you may be tempted to include as many as possible into your test. However, remember to err on the side of concision so as not to dilute the results of your test. Choose metrics that matter and prioritize those that directly relate to the goal of your test. Use an editing eye to stay within a reasonable range (4-8) to only include those that will provide the data you need to determine the success of your test.
Comments