User guide - Google Analytics for EPiServer 1 Beta
The user guides describes how to use EPiServer Google Analytics gadget with EPiServer CMS 6 R2, including step-by-step instructions and general concept information.
When the Google Analytics module is installed on the site, it will add a tracking script when a Tracking ID is configured in admin mode.
Table of contents
Introduction
With the Google Analytics gadget you can optimize the web pages you are editing through tracking. You can set up the Google Analytics gadget to provide access for editors to track the analytics and trends without having to log in to their organization's Google account. In addition, by using this feature you automatically apply tracking on all your pages on a domain or subdomain. You can configure the gadget to track a single website or several websites in a multiple-site environment.
Expected knowledge You are expected to have basic knowledge in Google Analytics. For more information how the tracking and measuring works, refer to documentation at Google Analytics.
User guide for administrators: Configuring Google Analytics
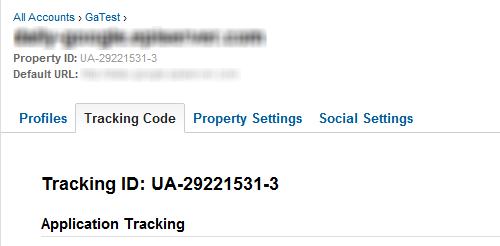
Note If your organization do not already have a Google account, create one by registering your website to Google Analytics. Follow the instructions on the site to generate the tracking code containing a Tracking ID as shown in the example below.
Accessing Google Analytics
From the Global Menu you can access Google Analytics from the following areas:
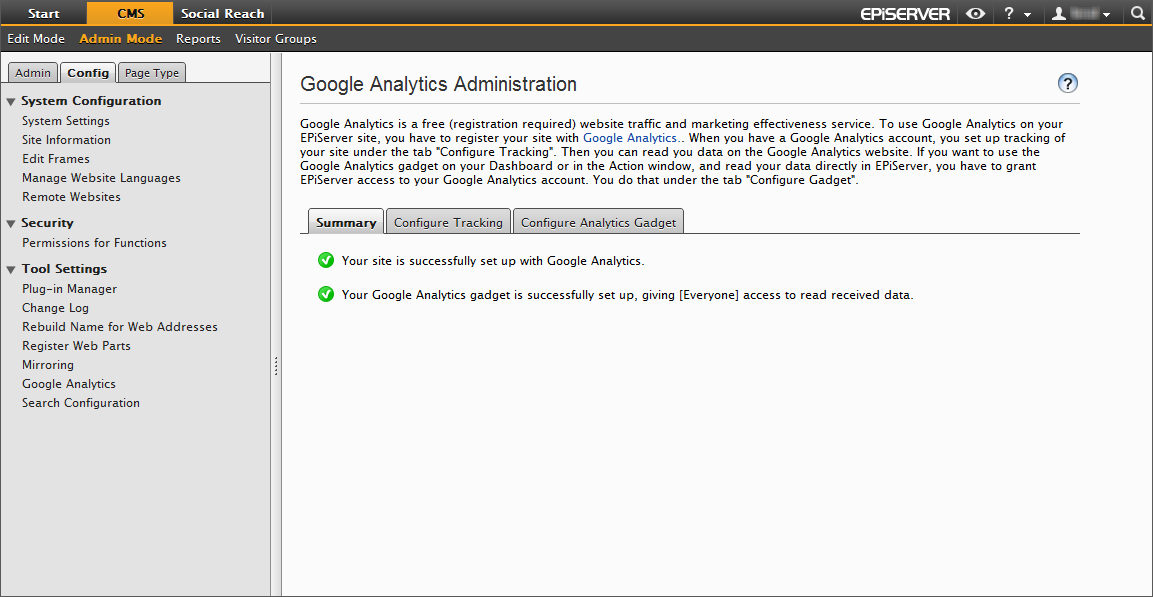
- Admin tab > Tool Settings > Google Analytics is where administrators connect the tracking ID to the site and access rights to the gadget. You will be redirected to the Google Analytics Administration page, which has the following tabs:
- Summary shows information about your tracking and gadget settings if you have set up the tracking and connected with Google Analytics.
- Configure Tracking, see description below.
- Configure Analytics Gadget, see description below.
- Dashboard is where editors can add the gadget to track the website visitors.
Configuring tracking
On the Configure Tracking tab you can control which tracking information about your visitors will be sent to Google.
Configure the tracking of your website as follows, and click Save when you are done:
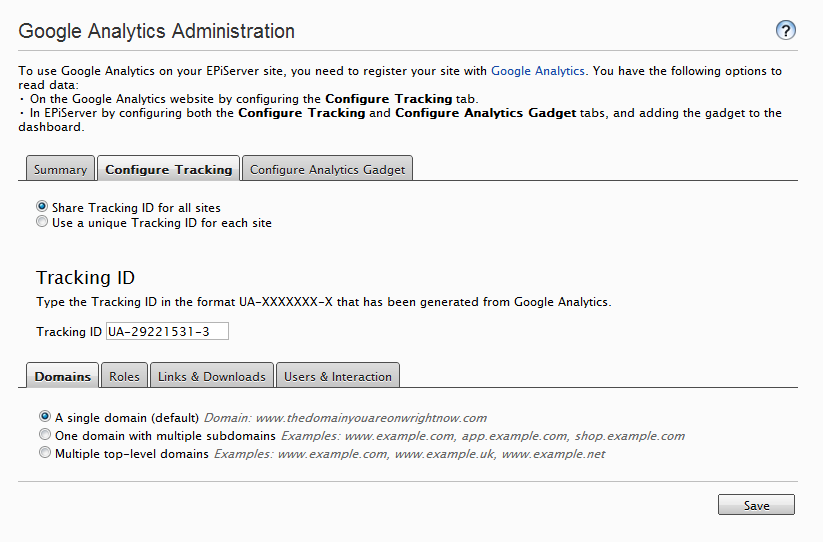
- Select the Configure Tracking tab.
- Select any of the following about what you want to track:
– Share tracking ID for all sites means that you track all sites using the same Tracking ID. All sites in an enterprise installation will use the same site. It is possible to further configure how Google interprets this on the Domains tab.
– Use a unique tracking ID for each site means that you track each site specifically by using an unique Tracking ID for each site in an enterprise installation. It is possible to further configure how Google interprets this in the Domains tab. Note that when this option is selected, you need to configure Tracking ID and settings on each site’s tab.
- In Tracking ID, connect your Tracking ID to your website (you can find it under your Google Analytics Settings page as shown above). The Tracking ID has the format UA-#####-#.
Domains
On the Domains tab, select any of the following options:
- A single domain. Track a single domain with the Tracking ID.
- One domain with multiple subdomains. Track one domain with multiple subdomains with the Tracking ID.
- Multiple top-level domains. Track multiple domains with the same Tracking ID.
Roles
On the Roles tab, select any of the following options:
- Track selected roles. Renders tracking only for users in the selected roles.
- Track everything except for selected roles. Renders tracking for all visits except for visits by users with the selected roles.
Links & Downloads
On the Links & Downloads tab, select one or several of the following options:
- Track clicks on external links. Tracks clicks on external links. All links with a link "http" or "https" that is not the same domain are considered to be external links. By selecting Track clicks on external links as page views you can track external links and convert them to virtual links as page views on the site, starting with "/external/".
- Track clicks on e-mail links. Tracks clicks on e-mail links (containing mailto tags).
- Track clicks on download links. Tracks clicks on file download links with the extensions defined in the pipe (|) separated list. The list of extensions is not case-sensitive.
Users & Interaction
On the Users & Interaction tab, select one or several of the following options:
- Track logins. Tracks logins on the site as an event.
- Track visitor groups. Tracks users becoming member of a visitor group as an event. To make this setting work, the Statistics check box need to be selected for the visitor groups on your website as described in the Administering Visitor Groups in the Administrator's Manual.
- Track form postings. Tracks form postings as an event (XForms).
- Track authors. Tracks author (user) creating a page as a custom property.
Configuring the Google Analytics gadget
You can view the analytics on the dashboard in OnlineCenter, by connecting the gadget to Google Analytics as follows:
- Select the Configure Analytics Gadget tab.
- To connect the EPiServer website with Google Analytics, click the Log in button..
- In Google Analytics Authentication, log in to the Google Analytics account with valid user name and password for your organization. When you add the gadget on the dashboard will be able to set up the gadget as described in the User Guide for Editors.
User guide for editors: Using the Google Analytics gadget
You can add the gadget to your dashboard in EPiServer OnlineCenter. Depending of how it is set up, the gadget shows a graph of the visitor statistics over different time periods. You can track one or several websites. The configuration of the gadget is done in Admin mode.
When you have added the gadget on the dashboard, click the arrow and set up the gadget by selecting the following menu options:
- Account & Profile. Log in with personal account and change which website to display the analytics for.
- Display Settings. Manage appearance of the graphs, and number of items in the list.
- Filter by. Choose or create custom segment for displayed data.
- Graphs & Lists. Select which kind of metrics to display, in graphs or lists.
The graphs shows the following information:
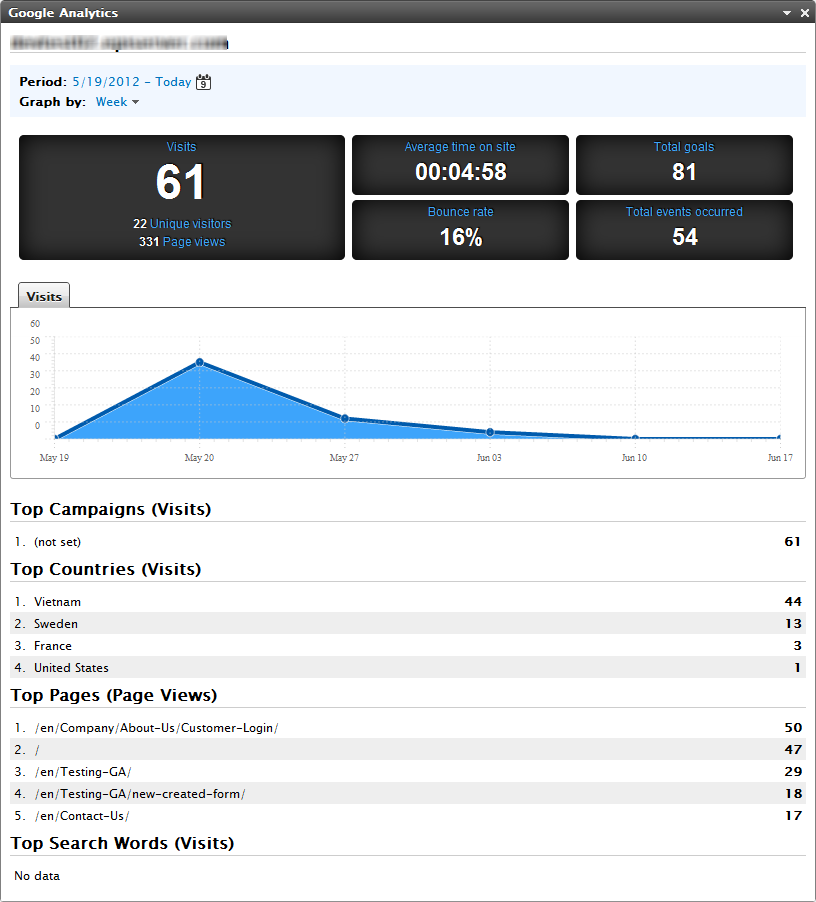

- Heading. The website name from Google or custom text. This is managed from Display Settings.
- Period. Date from and to for displayed data. The date range is saved for the gadget.
- Graph by. Allows showing graph data by day, week or month.
- Summary. A short summary for the selected date range and segment. This panel can be turned off from Graphs & Lists.
- Graphs. Graphs that are selected from Graphs & Lists. This is managed from Display Settings.
- Lists. Lists that are selected from Graphs & Lists. This is managed from Display Settings.
Account & Profile
With Account & Profile you can control the Google accounts and websites to use for retrieving the statistics and displaying them in the gadget. You have the following options:
- In Account, select your personal Google Analytics user account to log in and out as. It is also possible to select a shared user that is configured from the administration.
- In Profile, select any of the websites that you as a Google user is assigned to from the Google Analytics interface.
Display settings
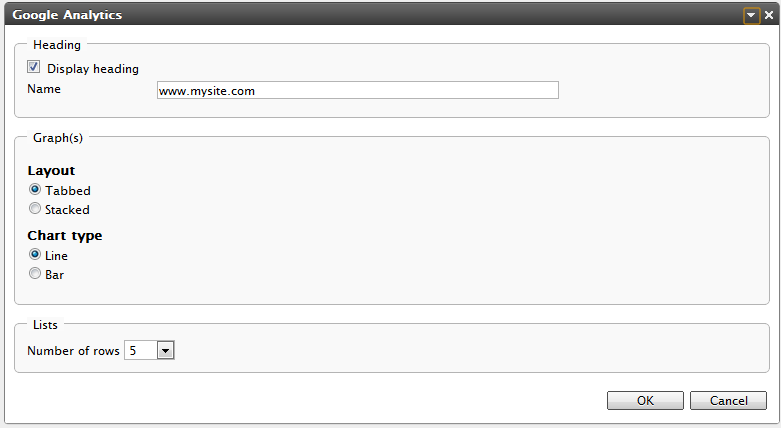
With Display Settings you can control the appearance of the gadget. You have the following options:

- In Heading, select Display heading to show the website name from Google as a heading in the gadget. If you want a custom heading instead, type the text in Name.
- In Graphs, you can select any of the following:
- Layout. Tabbed displays graphs in a tab panel, Stacked displays graphs in a vertical sequence.
- Chart type. Line connects values with a line, Bar displays a bar for each value.
- In Lists, select the number of items to display in each list.
Filter by
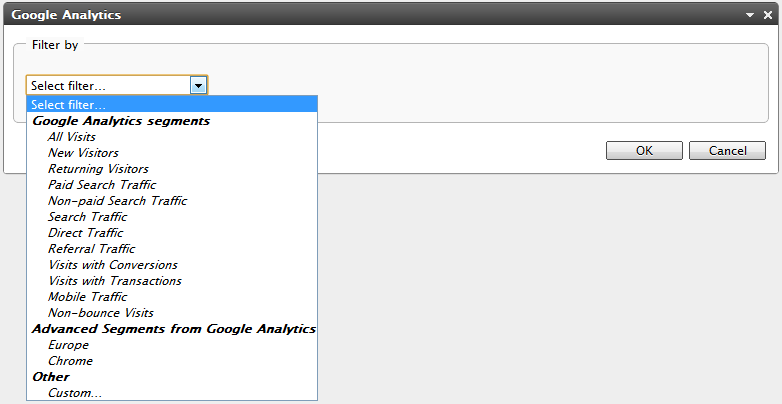
With Filter by you can control how the displayed data is segmented. You have the following options:

- Google Analytics segments are built-in segments that you can select in the list.
- Advanced Segments from Google Analytics are segments that you can define under “Advanced Segments” in the Google Analytics interface. For more information about advanced segments, refer to the Google Analytics website.
- Other are other segments that you can define within the gadget.


When you select Custom you can define the custom segment is displayed. The interface allows building a segment from a list of metrics, an operator and a text to match against the metric.
Graphs & Lists
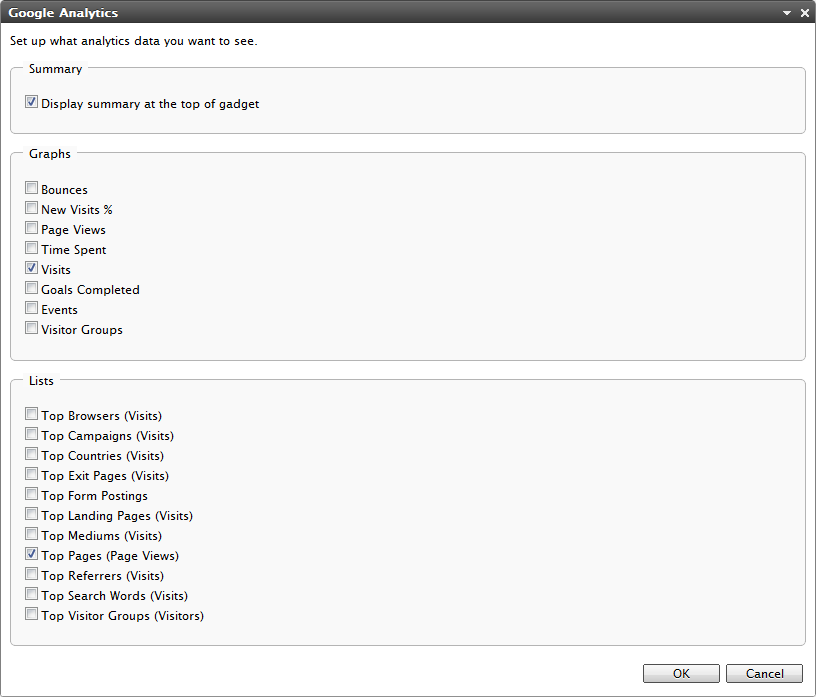
With Graphs & Lists you can control how the data is displayed in the gadget. You have the following options:

- Summary. Select Displays summary at the top of gadget to show the summary of the gadget.
- Graphs. Select any of the following to show in the graph area of the gadget:
- Time spent is the average time spent on the site by a visitor on the site.
- Bounces are users leaving after viewing the first page.
- Page views are the number of displayed pages on the site.
- % New visits are the number of first-time visits on the site.
- Visits are the number of visits to the site.
- Goals completed lists goals that have been configured in the Google Analytics interface. The graphs will display completions of these goals.
- Events lists available events. The graphs will display occurrences of these events.
- Visitor groups lists visitor groups set up with the system, select which visitor groups you want to see in the graph.
- Lists. Select to list the following criteria:
- Top Browsers are the most used browsers used to visit the site.
- Top Campaigns are the campaigns that your organization have set up in EPiServer Social Reach. Through this list you can see how these campagins are performing, see Creating and Sending a Message.
- Top Countries are the most common countries for visitors of the site.
- Top Exit Pages are the most common pages a user visited before leaving the site.
- Top Form Postings are the most commonly posted forms (XForms).
- Top Landing Pages are the most common landing pages when first entering the website.
- Top Mediums are sources that Google analyzed for incoming links, for example, twitter, search. Refer to Google Analytics documentation.
- Top Pages are the pages views most times.
- Top Referrers are the top referring domains that link to your website.
- Top Search Words are the most common search terms revealing the site.
- Top Visitor Groups shows the most common visitor groups, based on page views and personalized content.
Note If you are using EPiServer Commerce there will be other metrics available, for example, Performing Campaigns and Most Sold Products. Performing means cash earned grouped by product, source, campaign, product category, search keyword or internal search. There are also graphs for total revenue over time, items sold, and average cart size.
Last updated: July 2, 2012