
Performance improvements in CMS 11
Performance improvements are done continously but there are some that require breaking changes so I thought I mention some specifically that we did, they can have a huge impact on site performance.
Memory usage of PropertyData
Custom properties on any IContent is backed by a PropertyDataCollection that contains classes inheriting PropertyData. So in a running CMS site there might a ton of these classes cached into memory, small memory optimizations really make a huge difference here. In CMS 11 PropertyData was reviewed for references that did not had to be there, for example a reference to the LocalizationService was removed and backwards compatiblity with translation methods was resolved via extension methods instead. The more custom properties you have in a site, the bigger difference these changes makes to overall memory usage.
Load time from database
Previous optimizations and profiling we have done targeted a running site with a populated cache, for CMS 11 we tried to optimize cache misses when content is loaded from the database. For example, we changed so that the PropertyDataCollection is not created every time content is loaded from the database, instead a prototype is cached per content type and then cloned for each instance of that content type that is loaded from the database. This makes both the creation faster but also minimizes memory usage.
Memory usage in long running jobs
Jobs that go through all content in the database consume a lot of memory and you risk filling up the memory with content that never get accessed from the site, or even worse all content might not fit into memory. In those cases you would prefer to be able to control cache expiration, the default of 12 hours is probably not what you want.
It is now possible to define a cache scope with custom expiration:
var repo = ServiceLocator.Current.GetInstance<IContentRepository>();
using(var x = new ContentCacheScope { SlidingExpiration = TimeSpan.FromSeconds(10) })
{
   var content = repo.Get(contentLink)
   //etc..
}
Scheduled jobs uses cache scope and run with a custom expiration of 1 minutes by default. Note that custom cache expiration only affects cache misses when content is loaded from the database and added to the cache, any content already in the cache is not affected. Even though it is also possible to disable the cache completely, I would not recommend it since it puts a lot of strain on the database (caused by language fallbacks and other features, a single call to get content might generate several calls behind the scenes).
Performance test
To test some of these changes I created an ordinary Alloy demo site and generated ~10,000 pages. The test is pretty basic, it clear the cache and recursively loads all content from the database while monitoring memory usage via the Garbage Collector (GC) in a background thread.
I tested 3 different scenarios:
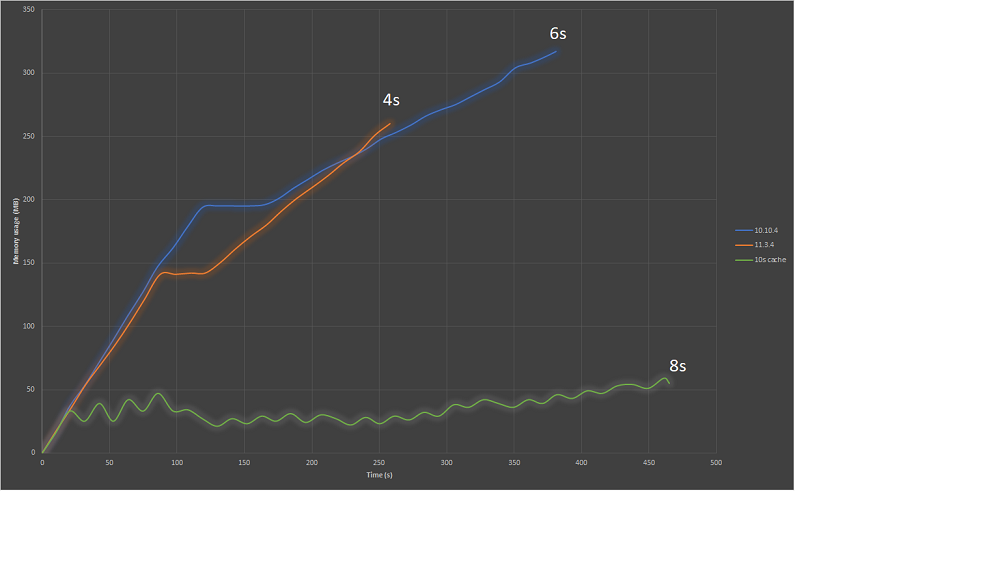
- CMS.Core 10.10.4 calling GetChildren recursively
- CMS.Core 11.3.4 calling GetChildren recursively
- CMS.Core 11.3.4 calling GetChildren recursively with cache scope set to 10 seconds
In this test just upgrading the site to CMS 11 made the code run 2 seconds faster and consumed 60 MB less memory. The green line indicates running with a cache expiration of 10 seconds which might be a bit too small to have any real value but it shows nicely that it is possible to keep memory usage down when required for long running jobs. The content was generated into 2 hierarchies causing a bump in the lines when it loads already cache content and then moving over to the second hierarchy of not cache content.
The Y axes is memory usage in megabytes and the X axis is time elapsed in seconds.
It might be worth mentioning here that there is a pretty nasty bug in ASP.NET 4.7.1 causing the cache scavenger that tracks memory usage to stop working, which might cause a site to run out of memory completely, you can read more about it here and here.
Comments