EPiServer CMS Site Performance Part 1: Introduction
In this series we will look at how we can make the “Cloud Clinic” demo site we built with EPiServer CMS 7.7 perform and scale better.
In this first part we will do some base line measurements so we can see how our site perform before we do any improvements. In future posts we will try to minimize the size of the page, add caching, use Azure’s automatic scaling, add a CDN and generally anything we can do to make it faster.
Our demo site: Cloud Clinic
In a previous post wrote about how I created the Cloud Clinic demo site. It is a very small and static site (no visitors groups or user log in). However the HTML/CSS/JS came from an external source (Template Monster) and is not of the best quality (as we sometimes get in real life projects).

A base line measurement
The first thing we need is to do some base line measurements. In this case I have used YSlow for Chrome, Google Page Speed Insights and LoadStorm.
Chrome and YSlow
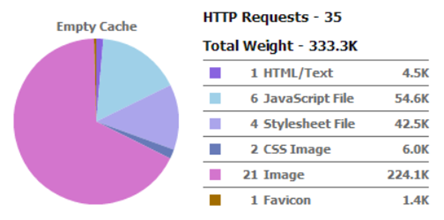
We can get a basic feeling for the size of the site (bytes on the wire), number of requests and rendering time using the built in developer tools for Chrome and the YSlow add-on.
Bytes transferred: 333.3KB
Requests: 35
Time: 1.27 seconds
Google PageSpeed Insights
The PageSpeed online tool gives you two scores: one for mobile and one for desktop. The scores give you a good indication on how fast your site is. In addition you get detailed lists on what you need to improve. In our case it complained about browser caching, render-blocking JS, CSS that needs minifying and images that are not optimized.
Mobile score: 64/100
Desktop score: 77/100

Load testing with LoadStorm
LoadStorm is a paid cloud based load testing tool, but they also offer a free “QuickStorm” load testing service with 10 vusers over 10 minutes.
First I tried to run this tool with my Azure Web Site set to the free plan. After about 4 minutes it stopped responding and stayed that way for hours. Turns out the free plan only gives you a certain amount of CPU time for each interval, and when that CPU time is used up it will stop serving the site until a new interval starts. (This is also the case for shared, but with a higher CPU quota.) I flipped the switch to “Shared” and ran a new QuickStorm test.
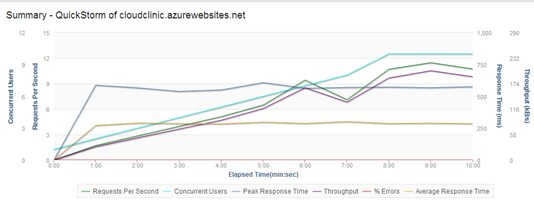
QuickStorm load tests the front page of the site starting with 1 vuser and adds another vuser very minute ending in 10 vusers for the last 2 minutes.
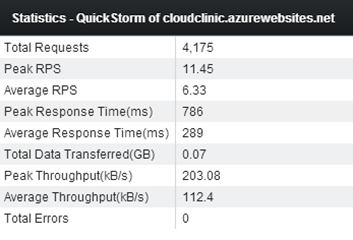
From the graph we can see that didn’t stress the site out as the average and peak response times stayed fairly even all through the test. Here are the details:

Summary
The demo site performance isn’t terrible, but it isn’t great either. Now we have some base line measurements that we can compare with.
Go to Part 2: Bundling and Minification


Comments