
Bug in ASPNET Cache causes problems with Azure Proactive Auto Heal
Update 2017-11-08
I have found the root cause for this buggy behavior, and have posted details and better workarounds in another blog post.
Original post
TL;DR default settings for cache memory usage don't work well with the recently launched Proactive Auto Heal feature for Azure Web Apps. Also, certain custom settings don't have the expected behavior, leaving the problem with Proactive Auto Heal intact. It seems you should avoid setting percentagePhysicalMemoryUsedLimit to around 50 %, the application will use less memory with a higher setting, e.g. 75 %.
Conflicting thresholds in Proactive Auto Heal and Cache scavenging
In august, Microsoft introduced the Proactive Auto Heal feature, which will recycle Azure Web Apps under certain conditions. One such condition is memory usage above 90 % for more than 30 seconds. This feature is enabled by default. It is also completely external to the hosting environment, so unlike the application pool memory limit in IIS it is unknown to the application.
This creates a conflict with the in-memory HTTP runtime cache. Cache is of course used to enable fast access to frequently used data, so if a large amount of memory is used for cache it is generally not a problem (actually quite the opposite). Using up all memory is of course a problem, which is why the .NET HTTP runtime cache will remove infrequently used items from the cache when the memory usage reaches a certain level, a process known as cache scavenging or cache trimming.
The problem is that the default maximum level of memory usage the cache tries to maintain can lie dangerously close to, or even over, the threshold for Proactive Auto Heal. So the application is suddenly recycled even though it is operating normally.
How Auto Heal recycles can hurt and how to (supposedly) configure around them
This is not only wasteful, but even creates problems in some scenarios. In an Episerver implementation, in particular one using Commerce, the total amount of content is vastly larger than what would fit in the server memory. So only the most recent and frequently used data (Episerver uses sliding cache expirations) will be available in cache, the rest will either have expired or been removed by cache scavenging. Some tasks, like indexing or exporting data, need to read through all the data, meaning (parts of) the cache can be churned multiple times and cache scavenging running high. This of course puts strain on the web server (and DB backend) performing the operation, but generally isn't a problem. However it becomes a big problem if the process is killed by Proactive Auto Heal, since there is no way to restart these tasks from where they were stopped.
The thresholds for cache scavenging are configurable. The system.web/caching/cache configuration element has the percentagePhysicalMemoryUsedLimit and privateBytesLimit attributes for this purpose. If you don't set them, a value is automatically calculated. The used values are available through the EffectivePercentagePhysicalMemoryLimit and EffectivePrivateBytesLimit properties of System.Web.Caching.Cache. A quick test showed that even for a low memory app service plan like S1 (1.75 GB RAM), the default EffectivePercentagePhysicalMemoryLimit is set at 97 %, clearly showing the problem with Proactive Auto Heal recycling the application at 90 %.
One way to get arund this is simply to disable Proactive Auto Heal. It has benefits though, so you think that a better option to limit the cache memory usage by specifiying the above mentioned config attributes. We tried that for a customer and set percentagePhysicalMemoryLimit all the way down to 50 %. And nothing changed. It still ran over 90 % and was recycled. We also tried setting privateBytesLimit to less than 50 % of the available memory of the machine. Again, no effect. What is going on?
Reproducing problems with the Cache configuration
So I set out to do some experiments. To rule out any issues in Episerver I started out with a plain .net 4.7 MVC template site from Visual studio and altered the Index method of the HomeController so that I can trigger it to insert some data to the cache:
public ActionResult Index(int? cache)
{
    for (int i = 0; i < cache; i++)
    {
        HttpContext.Cache.Insert(Guid.NewGuid().ToString(), new byte[40000]);
    }

    return View();
}
I deployed it to an Azure app service on an S1 (1.75 GB RAM) service plan and started loop in Powershell which will pass the Index method's cache parameter to insert 100 items totalling a little under 4 MB into the cache at 500 ms intervals.
while($true) { Invoke-WebRequest http://mytestsite.azurewebsites.net/?cache=100; Start-Sleep -m 500 }With the default cache settings this meant the memory usage would grow up to about 90 % where it seemed it started scavenging the cache to maintain that level (even though EffectivePercentagePhysicalMemoryLimit was 97 %, so it seems to start scavenging a bit below the threshold which is reasonable). But often it was recycled by Proactive Auto Heal because it stayed over the 90 % limit for too long.
I then started experimenting with different cache settings. I first tried percentagePhysicalMemoryUsedLimit setting of 50 and observed the same issue as we had seen before - the setting seemed to be ignored and it behaved like the default configuration, using up the memory and getting recycled. I then tried a setting of 40, and the behavior was completely different, it indeed seemed to limit the memory usage to about 40 %. WTF?
Results: Certain configured values have surprising effects
I tried several different settings and got different results, as you can see in these screenshots with the different percentagePhysicalMemoryUsedLimit settings overlayed:
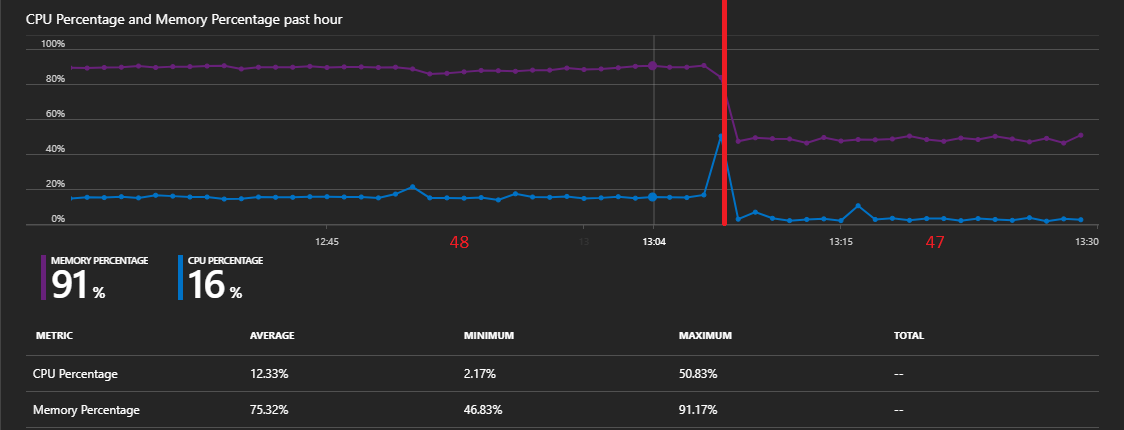
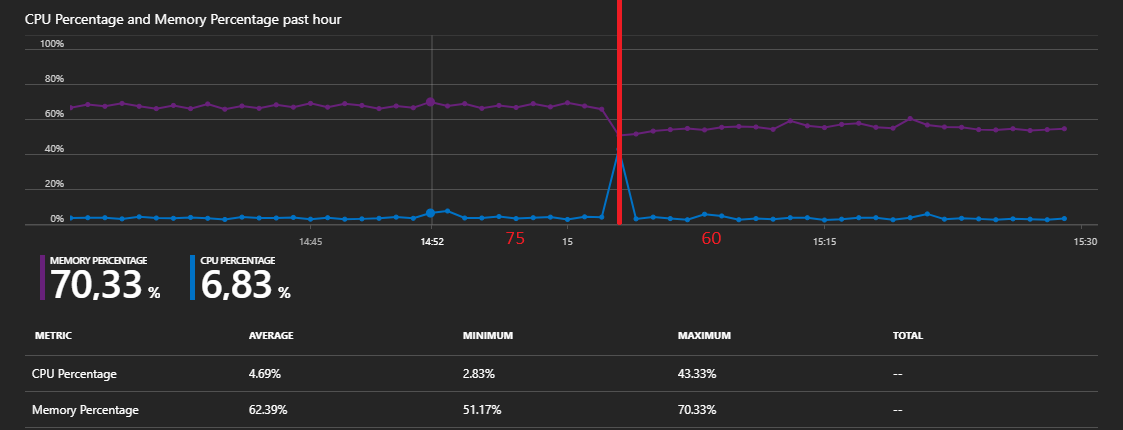
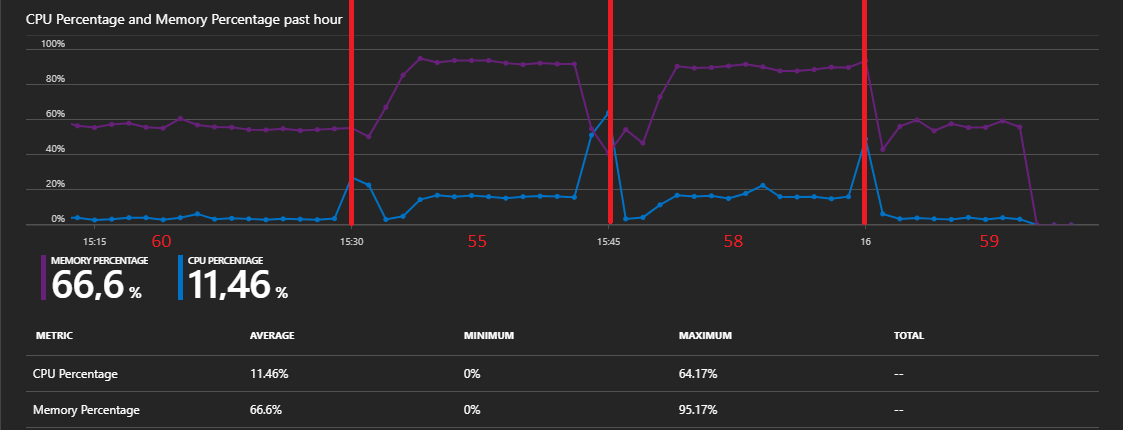
At a setting of 75, it used 75 %. 60 used 60, 45 used 45 %. Could 50 somehow be a magic number (not in any good way)? I tried circling it in. 47 worked as expected. 48 and it was again using up all the memory. 55 used up all the memory, as well as 58. 59 worked as expeced. I haven't tried every possible setting, but it seems that a setting in the range 48-58 makes it lose control of memory usage. At least for this plan size, but it is also consistent with the 50 % setting not working on the customer plan which was a larger size.
More surprises: Intermittent error condition?
So this seems to be a bug or at least unexpected behavior, just report it to Microsoft, right? Well... I set the setting back to 50 and suddenly it works as expected? WTF? I have since gone over different settings multiple times and the main pattern still seems clear: Within a range around 50, the setting is ignored and the memory usage goes out of control (or actually not completely, disabling Proactive Auto Heal to allow the app to live shows that it can stay stable for a long time at about 90 %). But sometimes it works as expected.
Conclusion: Use these config values
So in the end I still don't have a clean repro for a bug report, but the conclusion is the same: If you run your site on Azure Web Apps with Proactive Auto Heal switched on, set percentagePhysicalMemoryUsedLimit to a value below 90 % to avoid unnecessary recycles, but above 60 % to avoid this strange behavior and to make the most use of your server memory. And validate that it behaves as expected for your instance size.
And as a final note: privateBytesLimit does not seem to have any effect at all in .net 4.7 (or at lest not Azure app services), it does not even affect the reported EffectivePrivateBytesLimit.
Comments